Notes for Prof. Hung-Yi Lee's ML Lecture 13: Unsupervised Learning- Linear Methods
Unsupervised Learning
Unsupervised learning are the scenarios that we only have either input or output for the function. Examples for the former (化繁為簡) are dimension reduction and clustering, while an example for the later (無中生有) is generation.
Clustering
“How many cluster” is still an open question; we have to decide it.
K-Means
To cluster $X = { x^1, \dots, x^N }$ into $K$ clusters by their mean.
Steps:
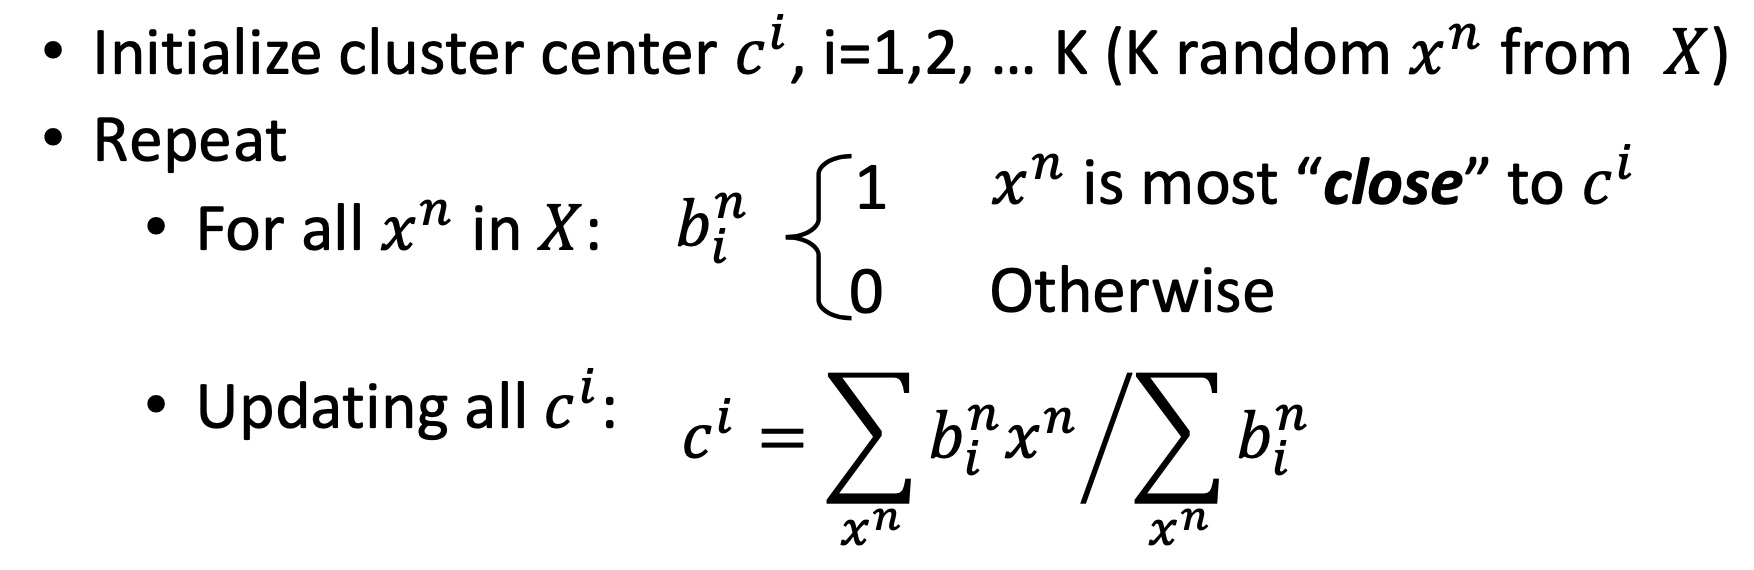
When initializing the centers of the clusters, we randomly choose from the data set to avoid the segmentation fault that some clusters have no data points.
My discussion
Q: How about that some of the randomly chosen data points in initialization should actually belong to the same cluster?
A: It’s possible, intuitively. However, since we just don’t really know how many clusters should the data set be separated into, so possibly the better approach is to set the number $K$ slightly higher in the beginning and then we can manually merge the clusters later if we see some clusters are close to each other.
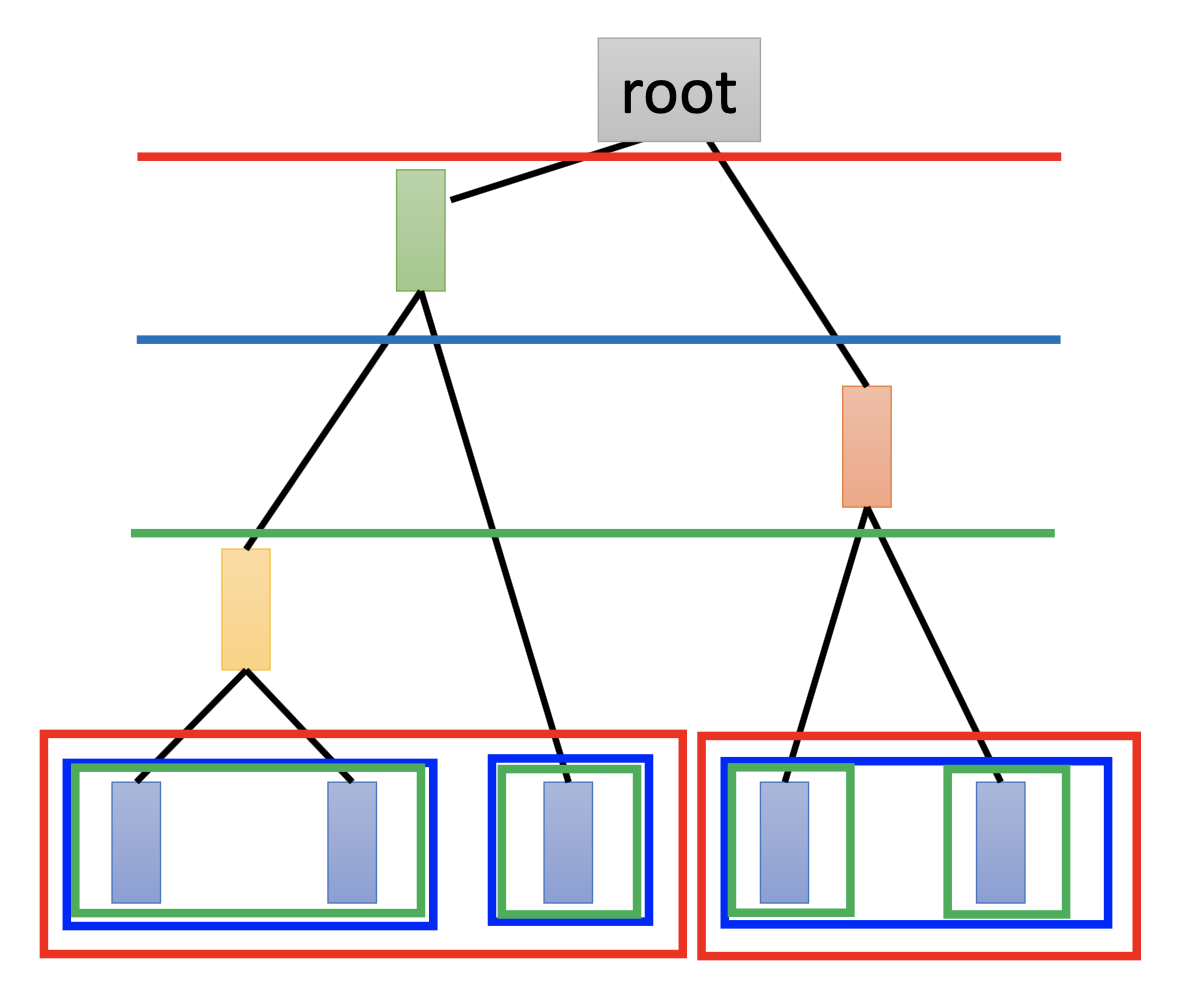
Hierarchical Agglomerative Clustering
Step 1: build a tree
Find the closest 2 examples in the data set, make them a cluster, and then use their mean to represent this culser as a new data point. Repeat such process until getting the root, i.e. make the whole data set as a tree.
Step 2: pick a threshold
Choosw a level in the tree and separate the tree into clusters by that level.
More of My Discussions to Clustering
Aren’t there any clustering methods based on low density separation assumption or smoothness assumption? Unsupervised SVM for the former? DBSCAN for the later?
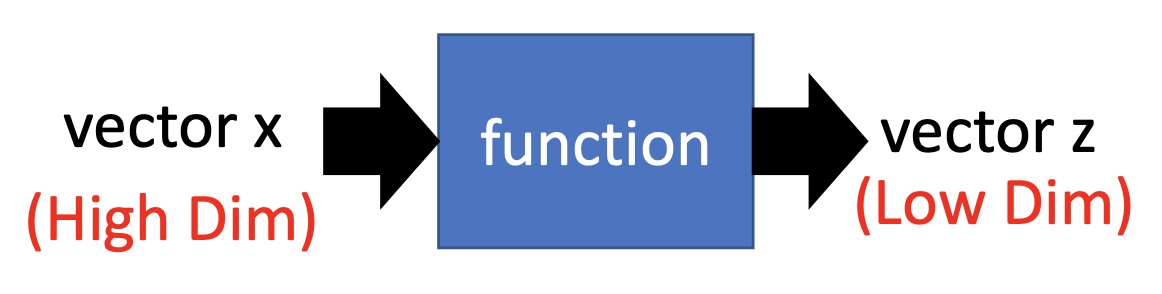
Distributed Representaion / Dimension Reduction
Transform the high-dimensional examples into low-dimensional representatils by using their attribute or characteristics.
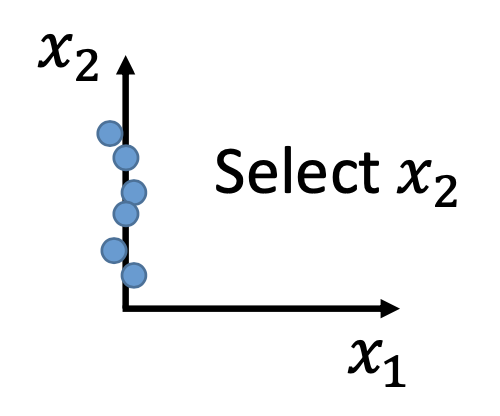
Feature Selection
Manually choose the dimensions of features that emphasizes the differences between the data points.
Principal Component Analysis
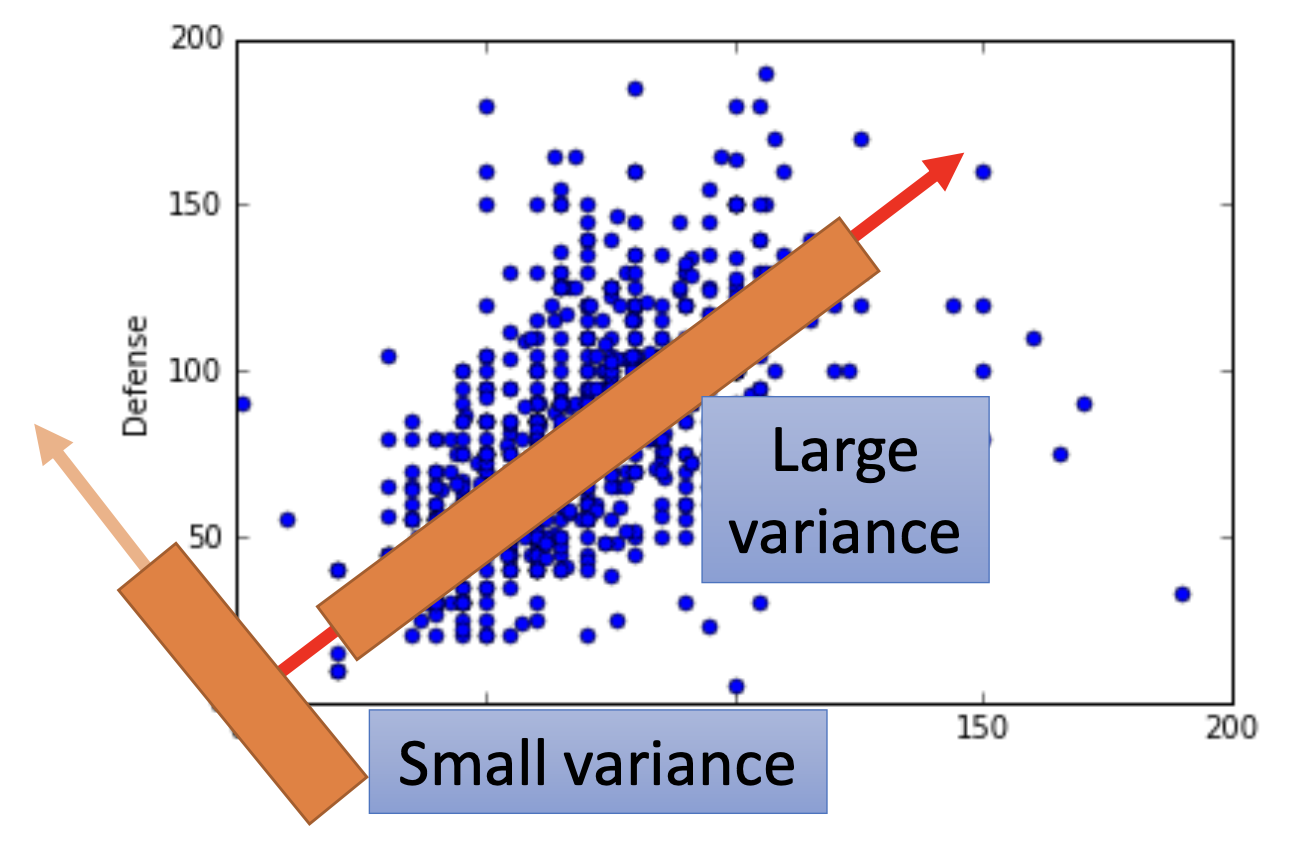
Miximizing Variance after Projection
By PCA, we project all the data points $x$ onto $W$ to get a set of $z$ of lower dimensions, while we want to find the $W$ to let the variance of $z$ be as large as possible.
Definitions
We have
\[z = Wx\]where
\[W = \begin{bmatrix} (w^1)^T \\ (w^2)^T \\ \vdots \\ (w^n)^T \\ \end{bmatrix}\]and
\[z_n = w^n \cdot x\] \[w^n = arg \max \limits_{w^n} Var(z_n)\] \[Var(z_n) = \frac{1}{N}\sum_{z_n}(z_n - \overline{z}_n)^2\]where $Var(z_1)$ is the largest, $Var(z_2)$ the 2nd largest, then $Var(z_n)$ the nth largest, repectively.
Solution
$w^1$ to $w^n$ are the eigen vectors of the covariance matrix $Cov(x)$, with eigen value from the largest to nth largest, where
\[Cov(x) = \frac{1}{N} \sum (x - \overline{x})(x - \overline{x})^T\]Discussion
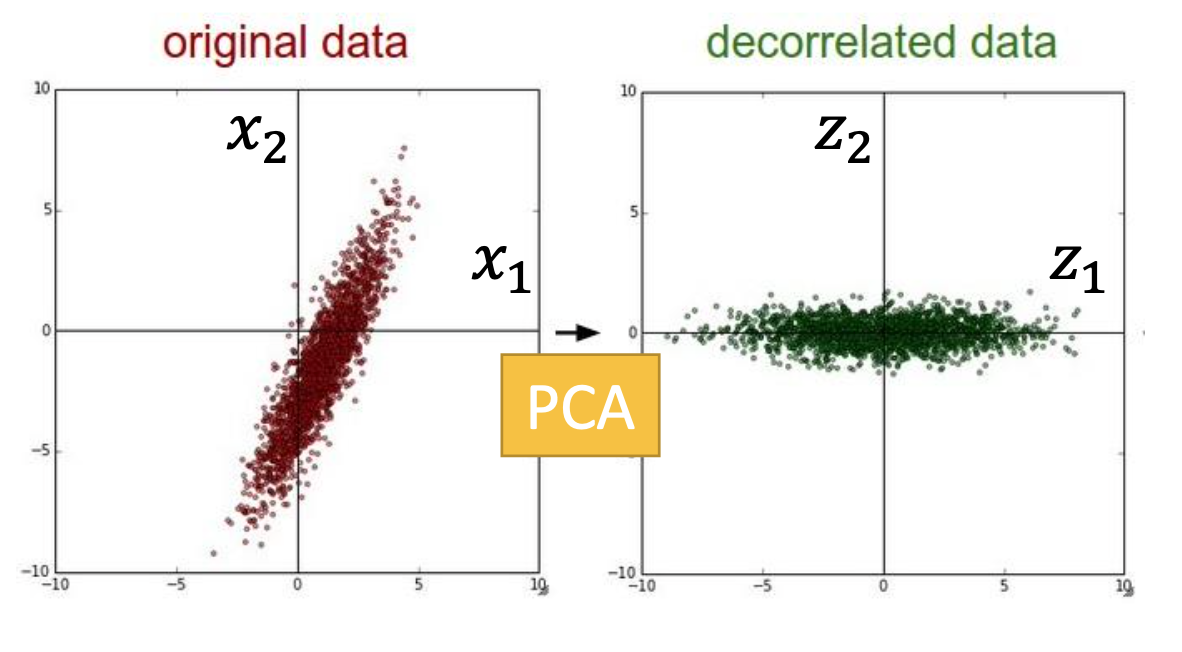
After transformation by $W$, the covariance matrix $Cov(z)$ is a diagonal matrix, i.e. the transformation has a decorrelation effect on the data points.
Minimizing Reconstruction Error
We can also see PCA as finding a set of representations that minimizing the reconstruction error between $x - \overline{x}$ and the reconstructed $\hat{x}$, i.e.
\[x - \overline{x} \approx c_1 u^1 + c_2 u^2 + \dots + c_k u^k = \hat{x}\]and the reconstruction error
\[\vert \vert (x - \overline{x}) - \hat{x} \vert \vert_2\]and by singiular value decomposition, the k eigen vector with the largest eigen value of the covariance matrix $Cov(x)$ is the solution, i.e. from PCA, the set of vectors
\[\{ w^1, w^2, \dots, w^k \}\]is the set of component of
\[\{ u^1, u^2, \dots, u^k \}\]that minimize the reconstruction error.
Also, we can also see PCA as a neural network with 1 hidden layer and linear activation function, and also an autoencoder, which minimize the reconstruction error
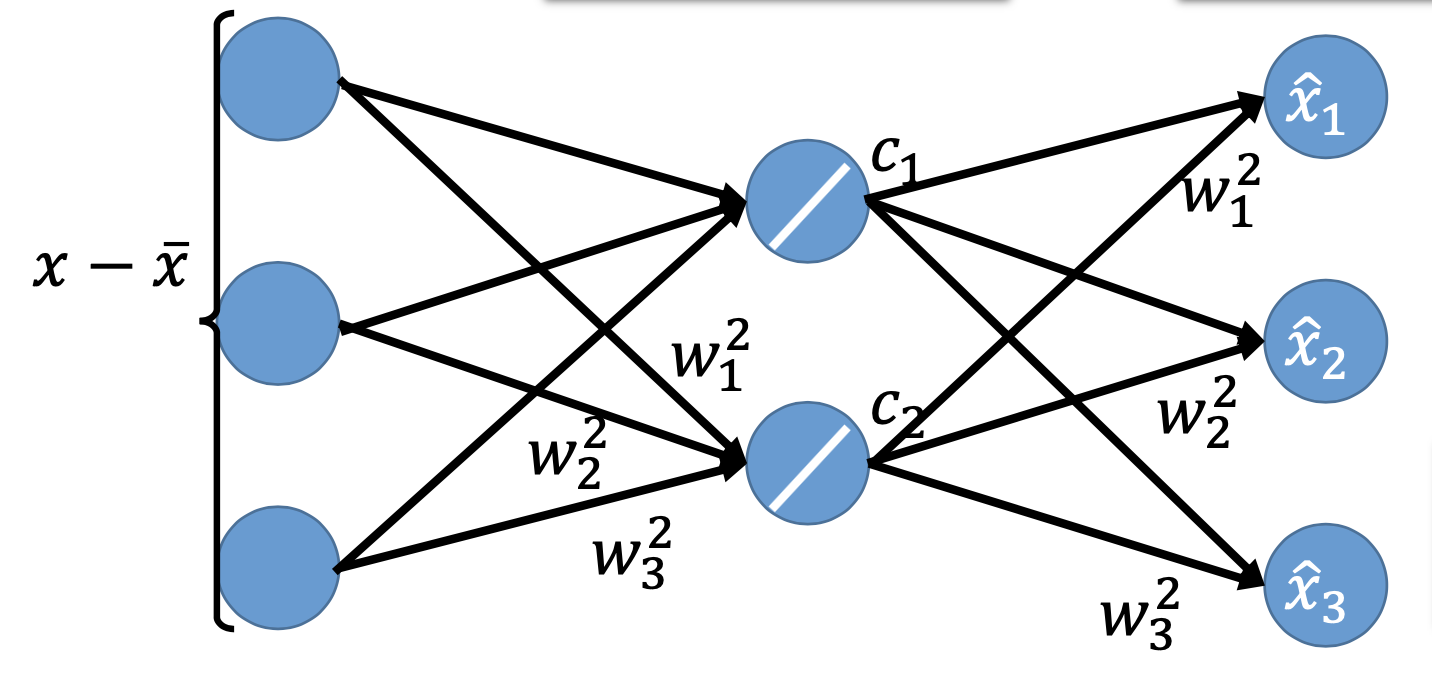
Since it’s a neural network, we can we gradient descent to find the $w$s. Howeverm the $w$s may be different from the ones we get from PCA because the $w$s are not constrained to be orthonormal like in PCA.
Also, it becomes deep autoencoder if we let it be deep.
Discussion
PCA keeps the distances from high to low dimensional space. (My comment: not really. there are kernal in the linear transformation, so some distances may just disappear by the transformation. Although if the distance between points A and B is larger than the distance between points C and D, after the transformation, the former is still not smaller than the later.)
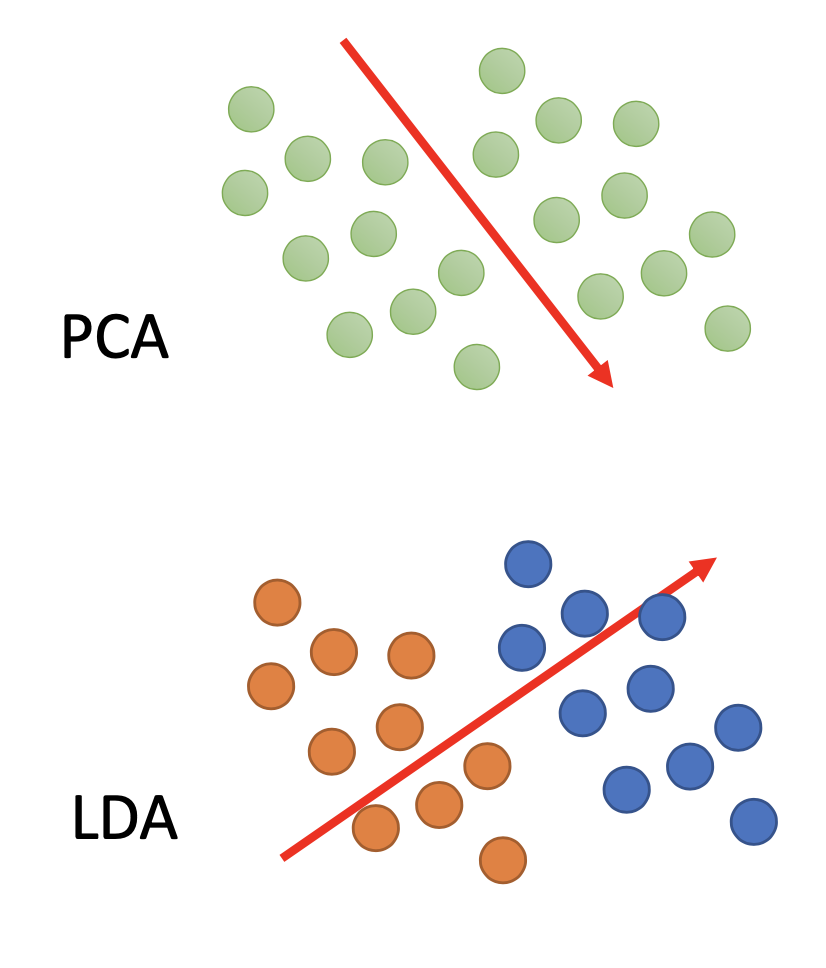
Weakness of PCA: PCA is unsupervised and doesn’t consider the labels, so in some cases, it cannot find the proper direction of projection to separate the data points. The linear discriminant analysis, a dimension reduction that considers the labels, for example, can perform better for such scenario.
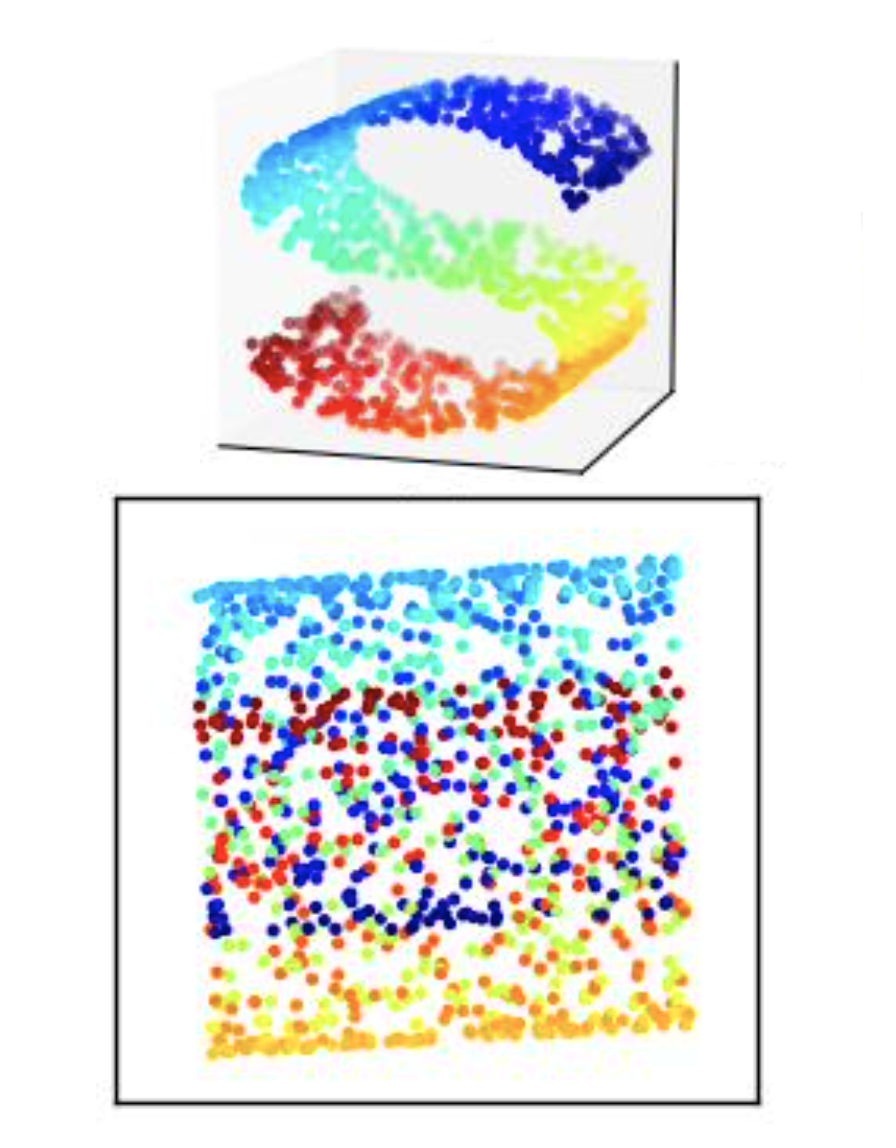
Also, since PCA is linear, it cannot provide good results when the distribution of data is highly nonlinear.
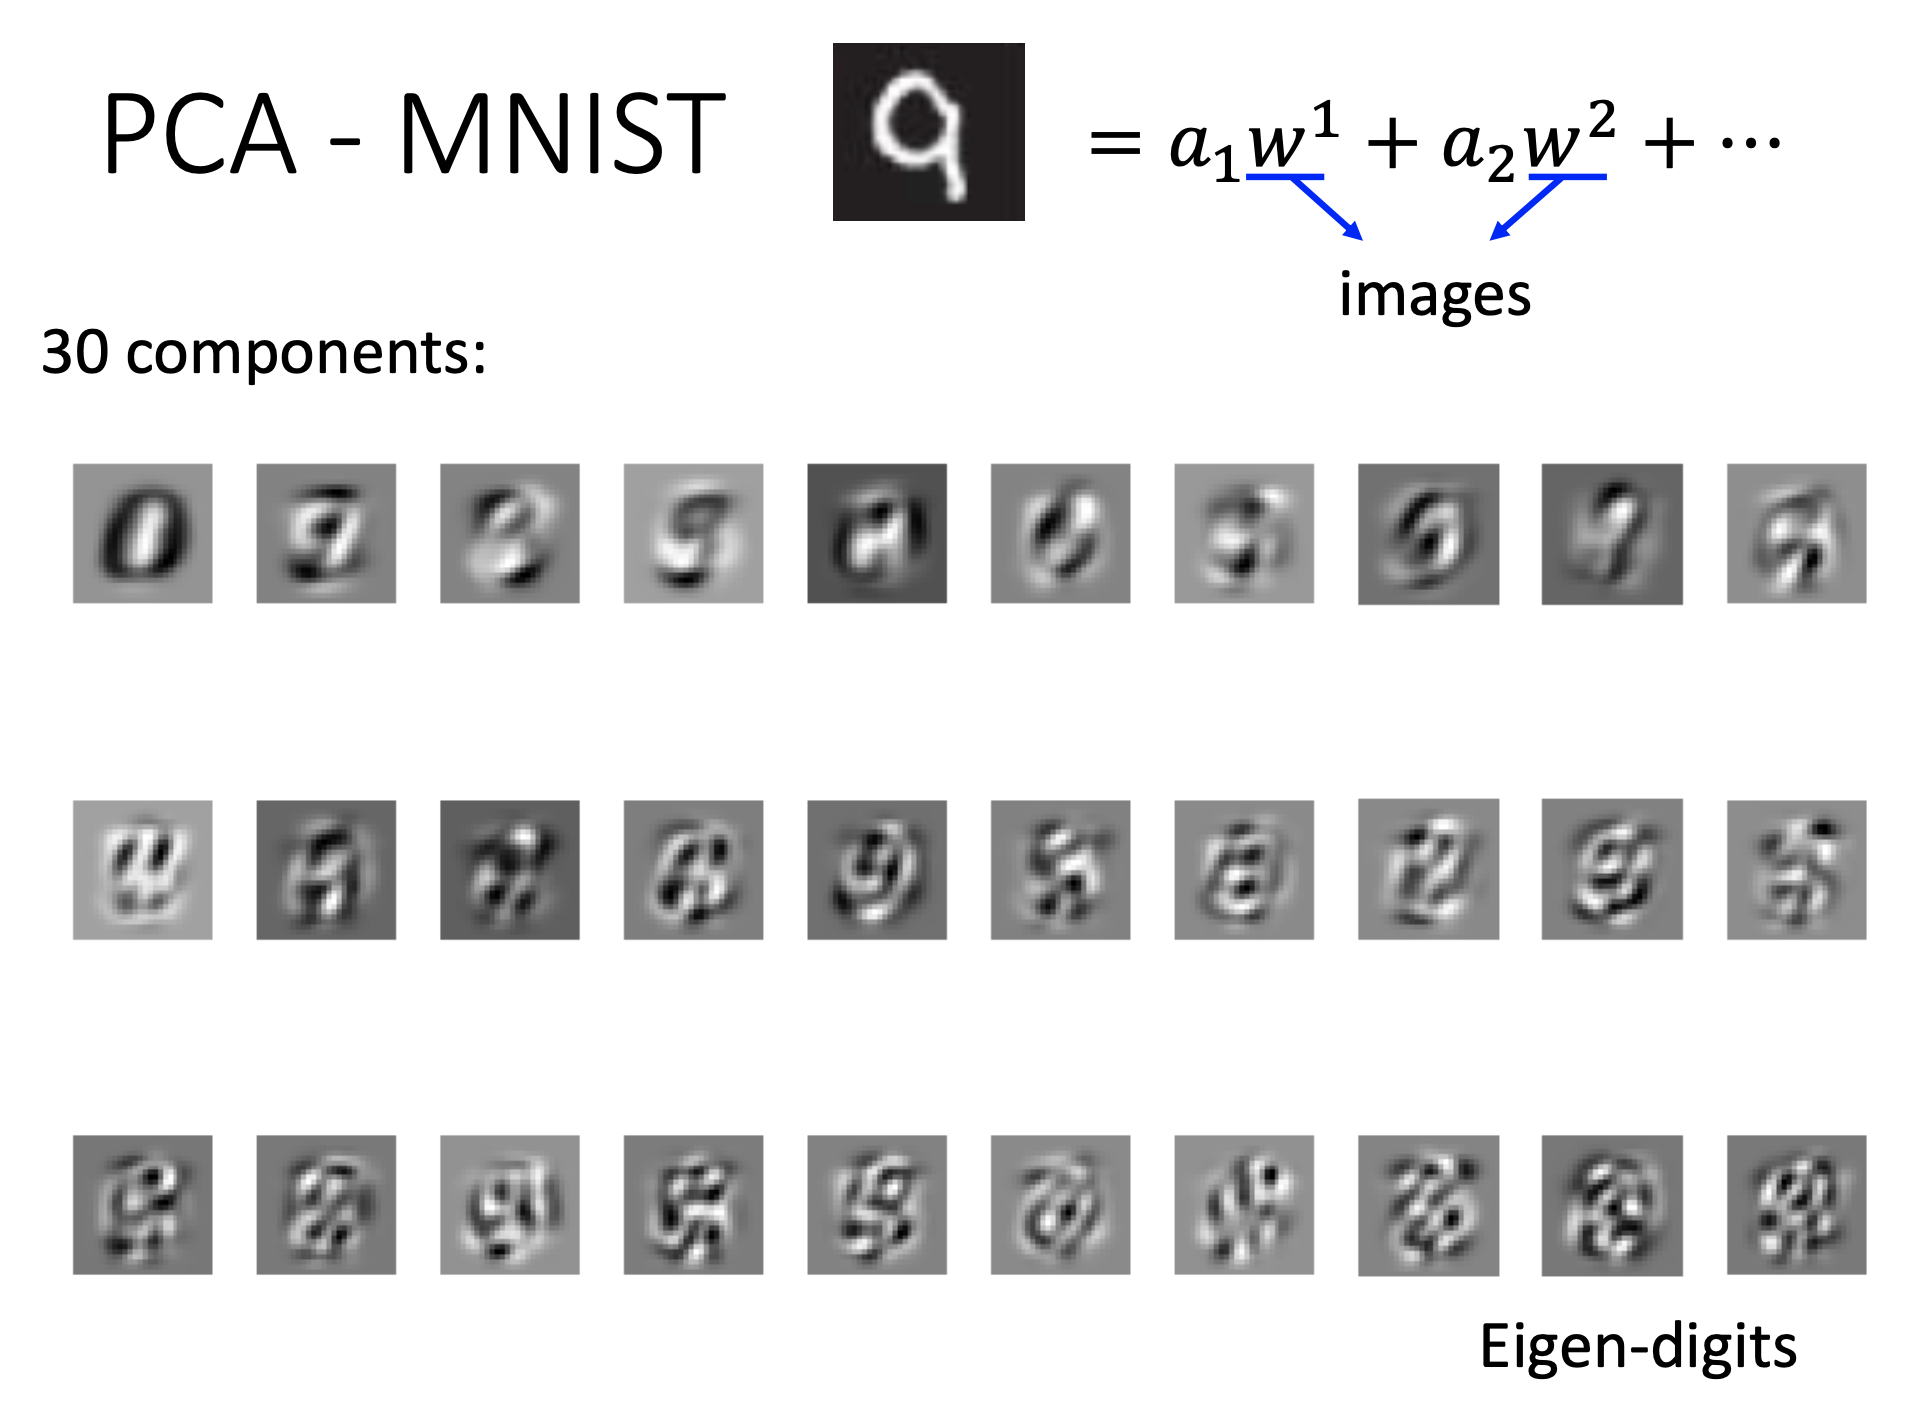
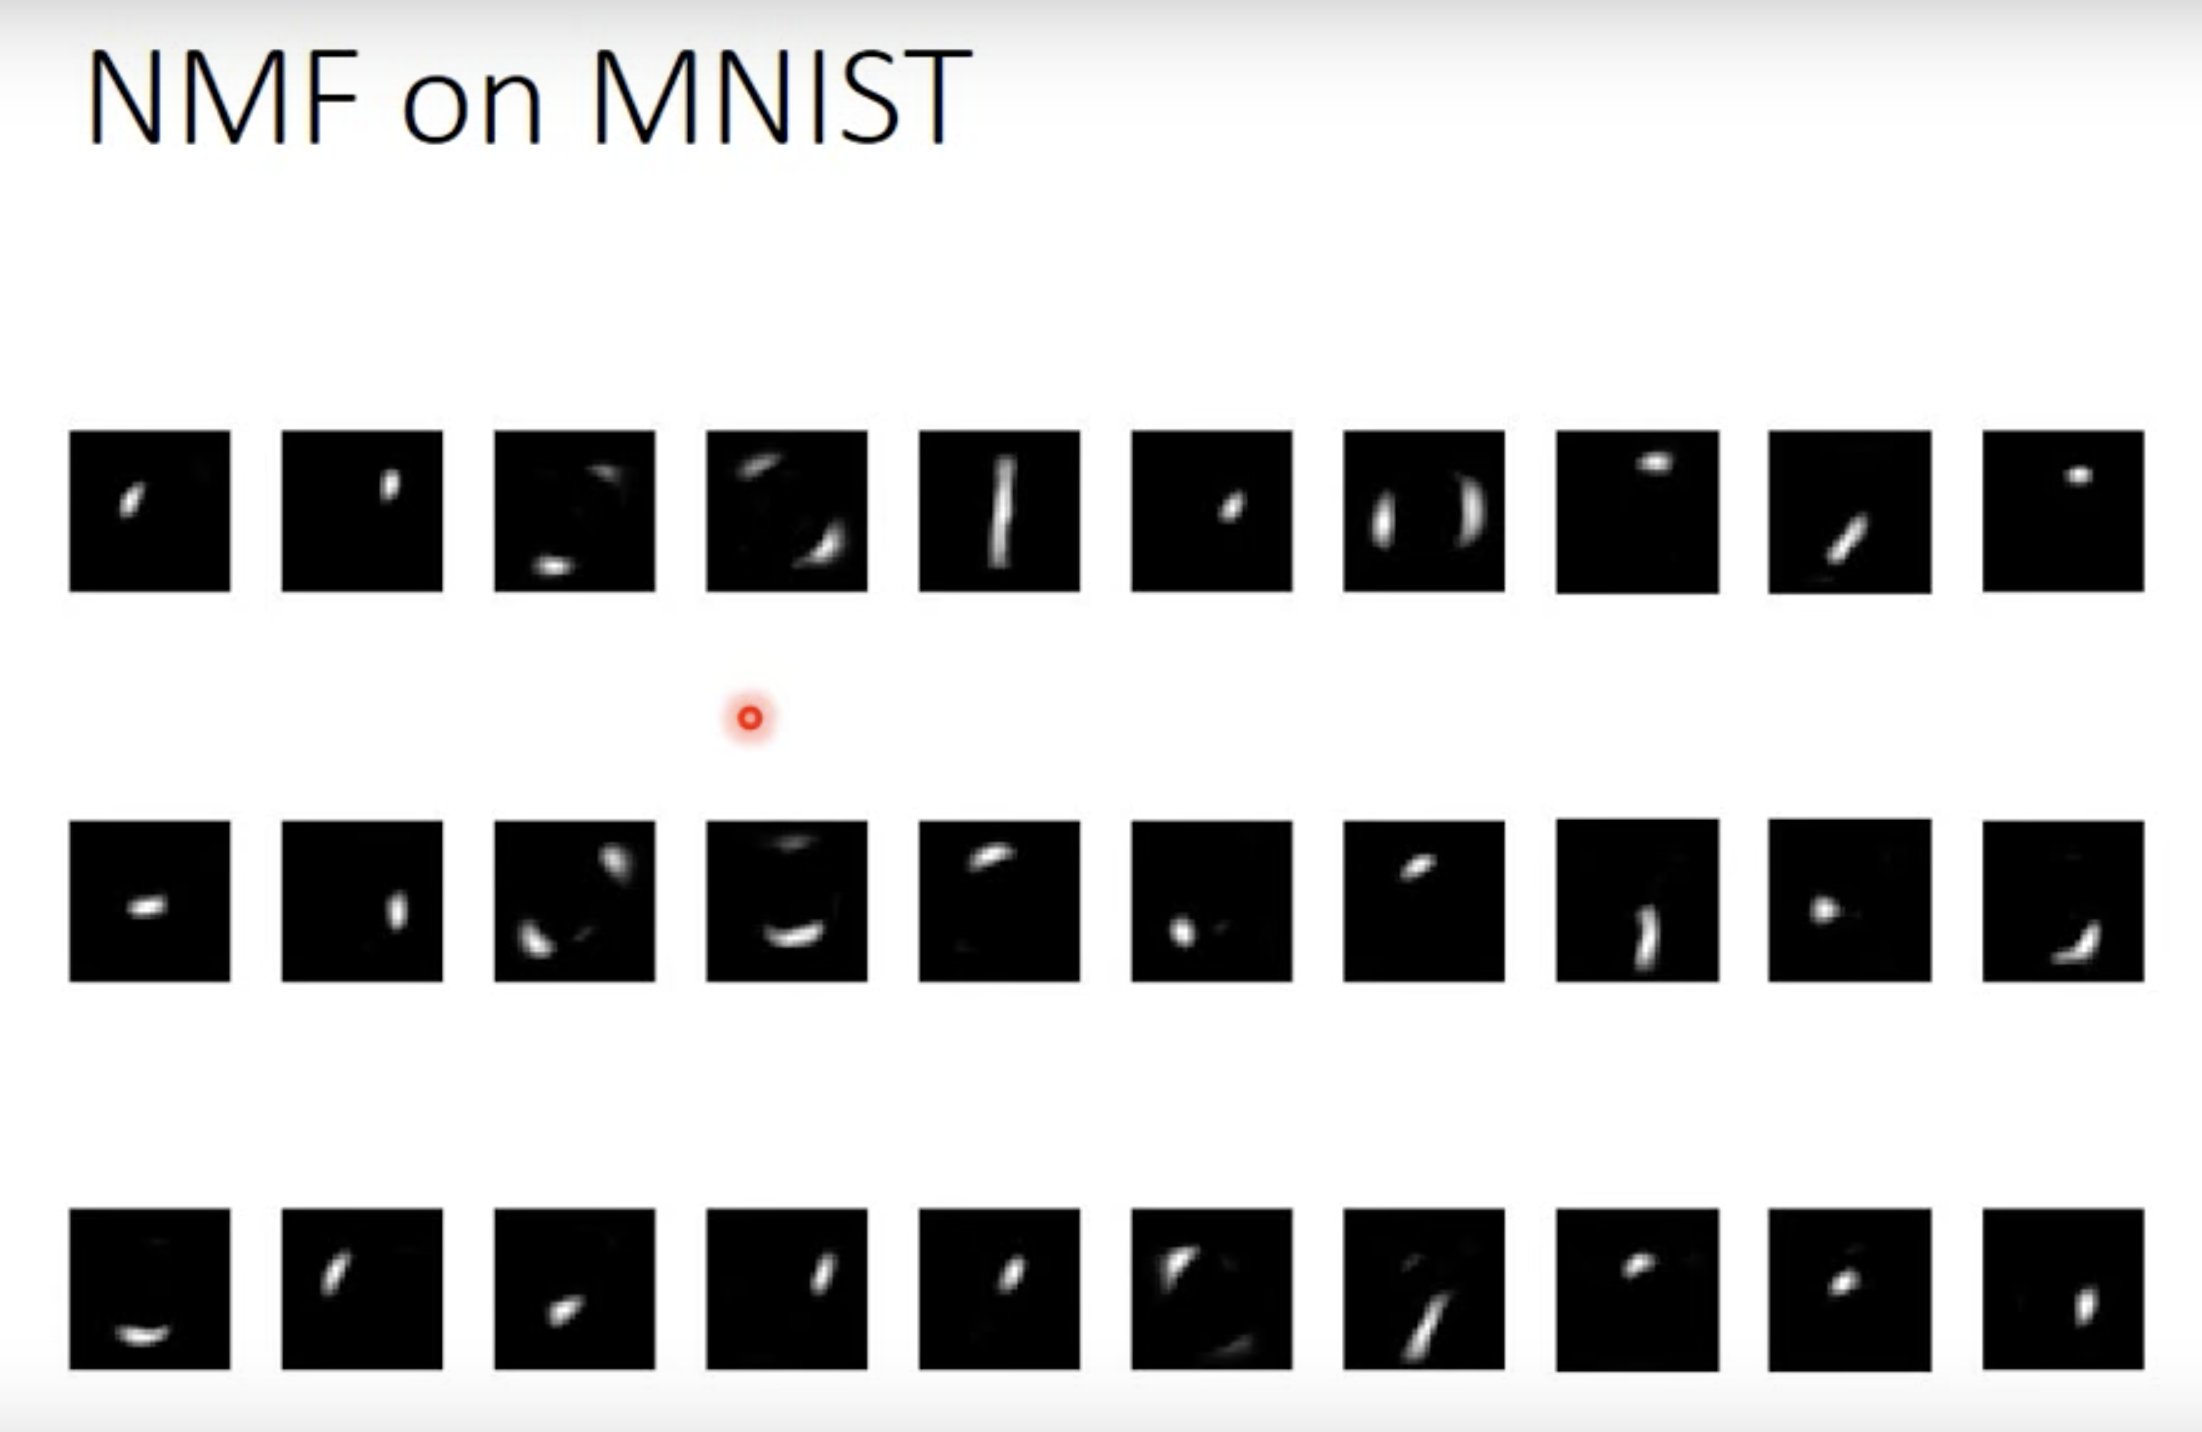
Also, when examing the selected components of image data, we may see that the components don’t look like elements of the drawing. The reason is that the components $w$s and the projections $z$s can have negative values. To get component that looks like elements of the drawing, we can use non-negative matrix factorization, for example.
Matrix Factorization
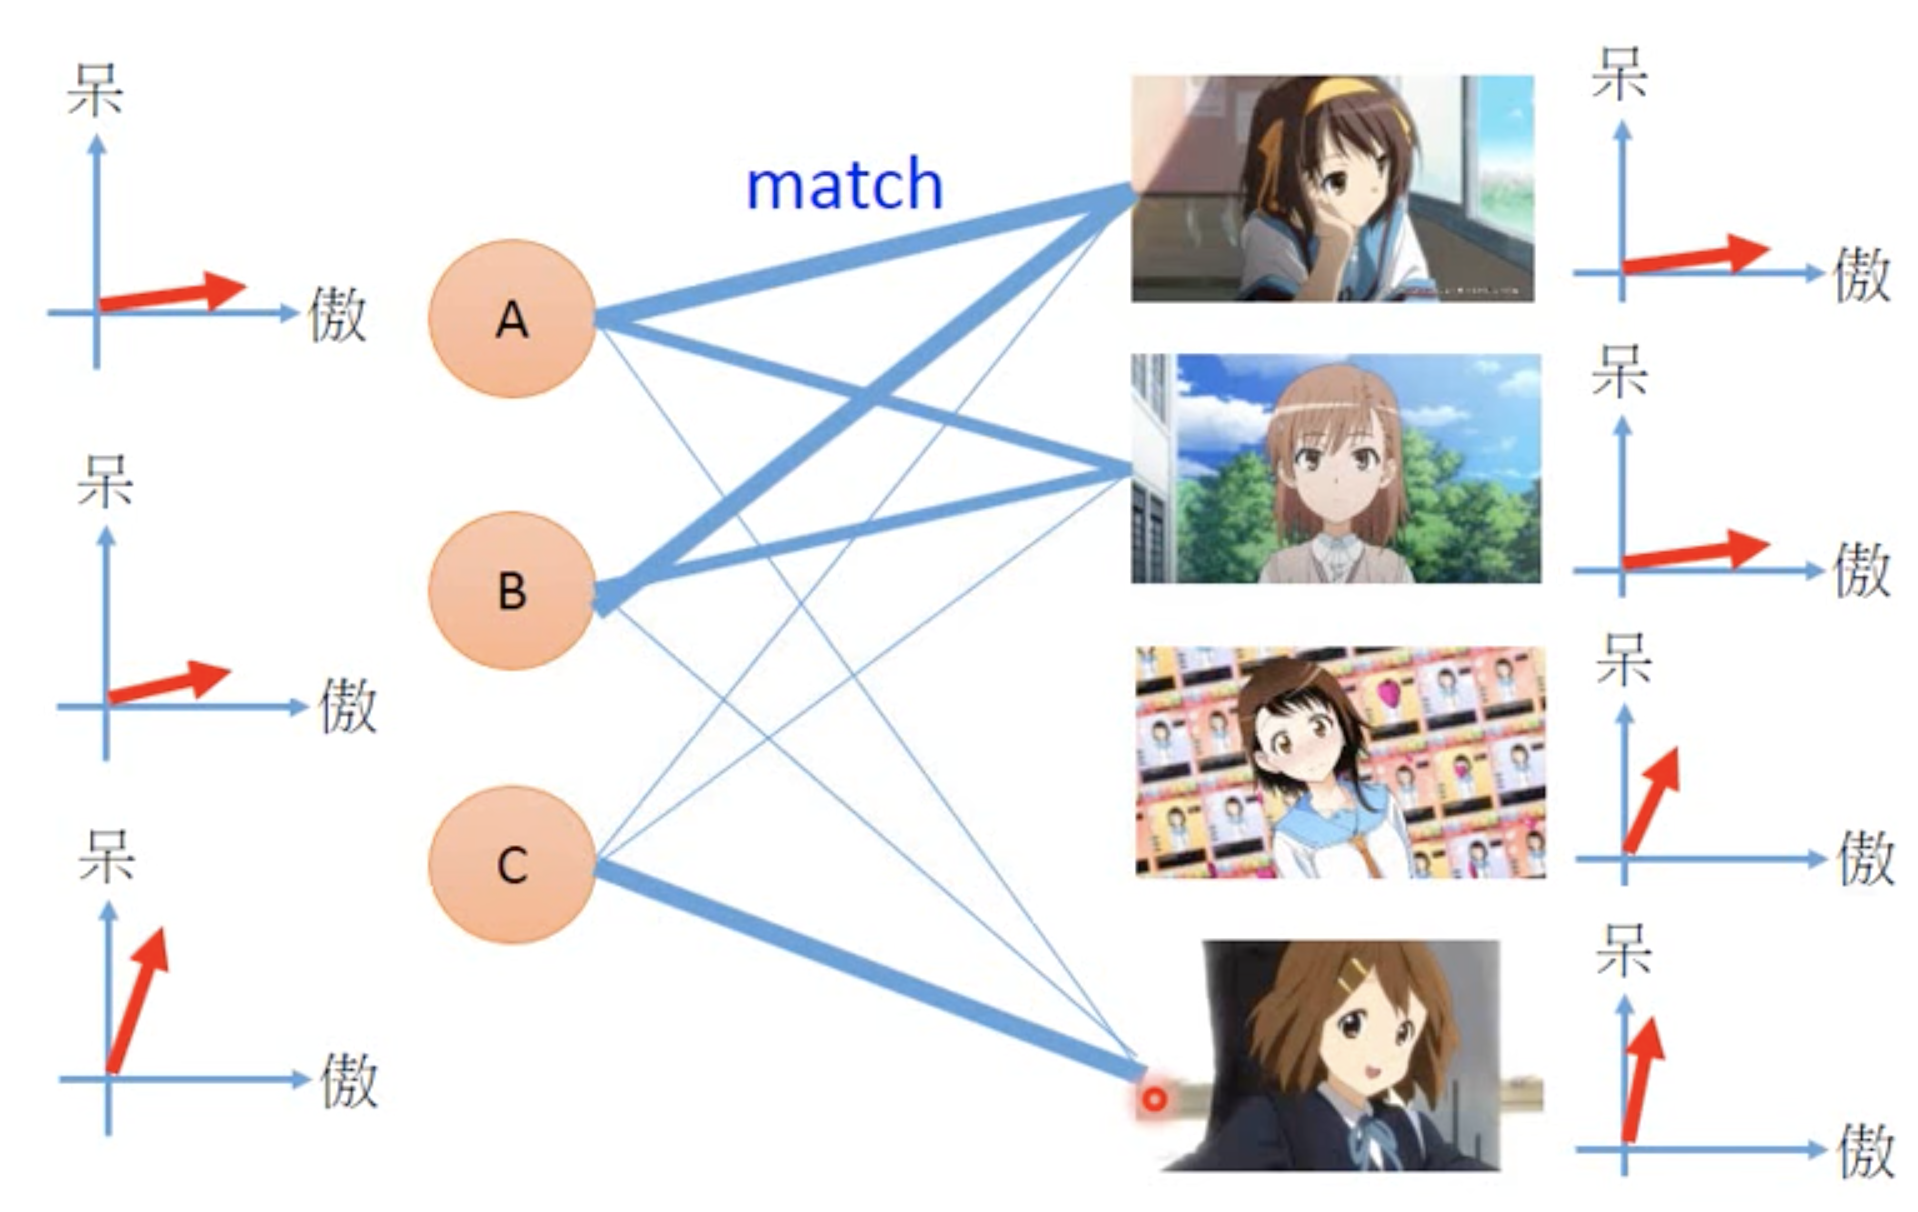
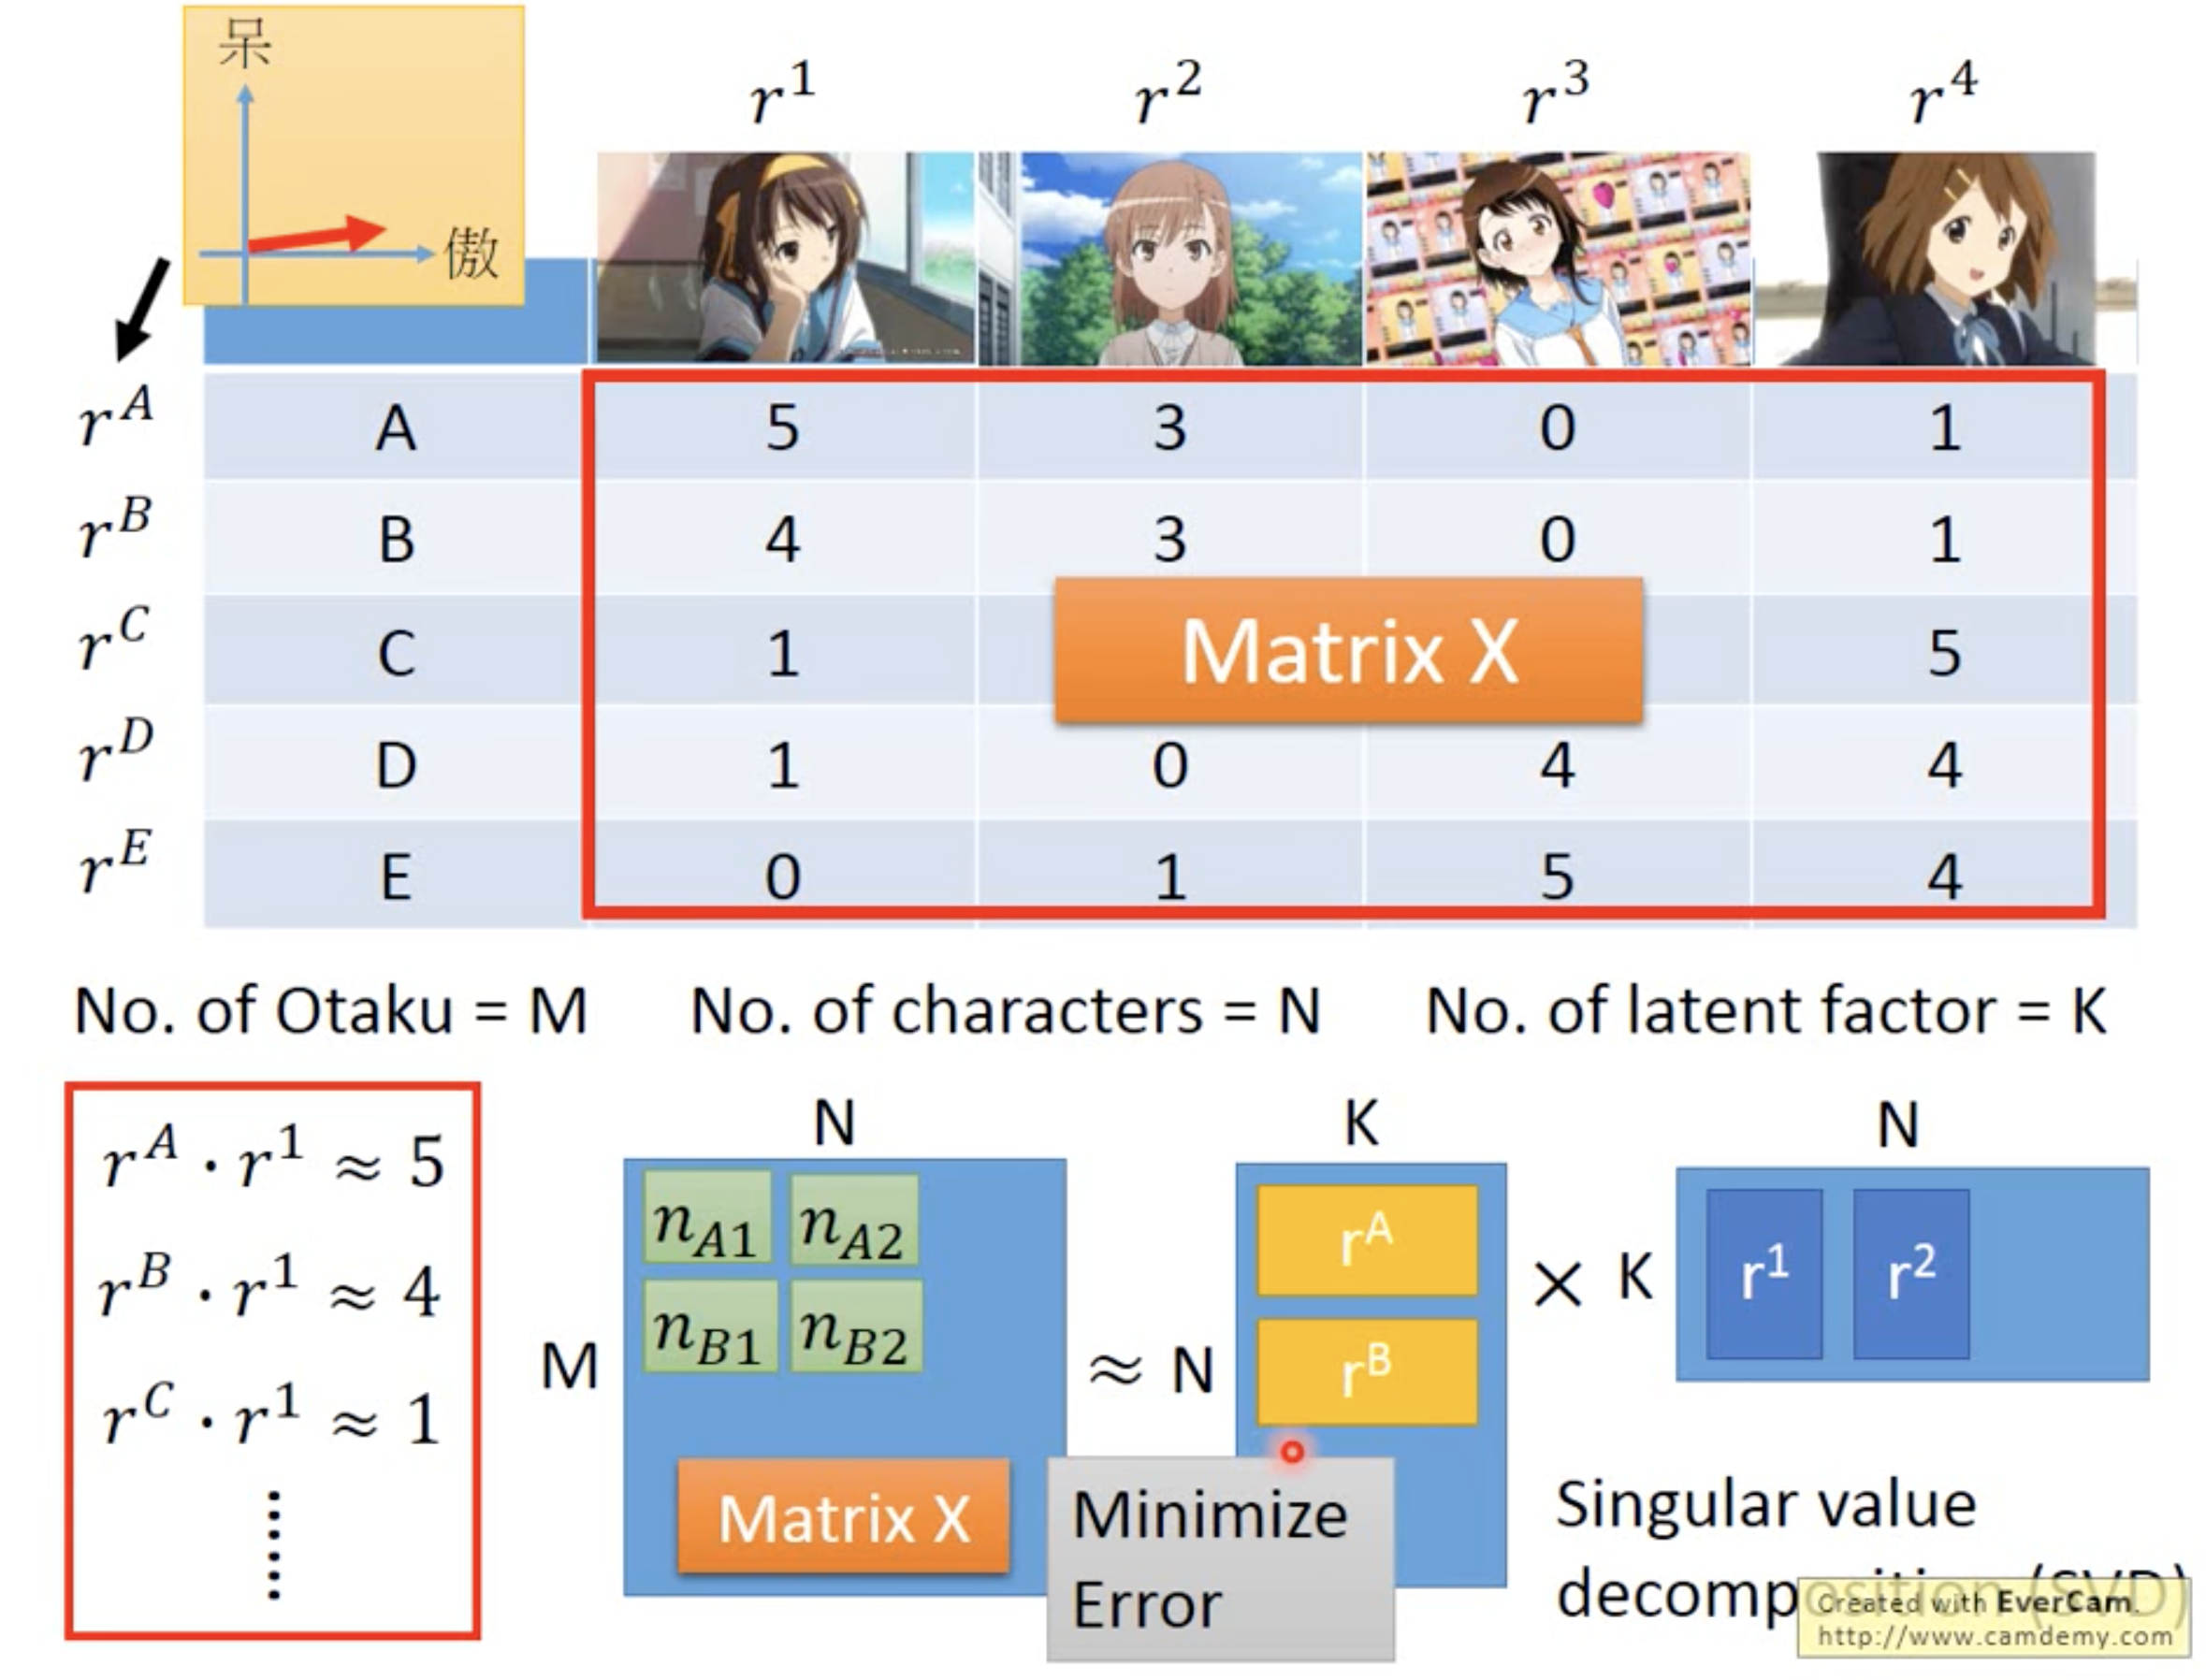
We assume that every variable and every target can be described by a latent vactor of n dimentions, and then we use the data to solve the latent vactors for all the variables and target. Such technique can be applied for recommendation system. For example, the data of variables (otakus) and targets (characters)
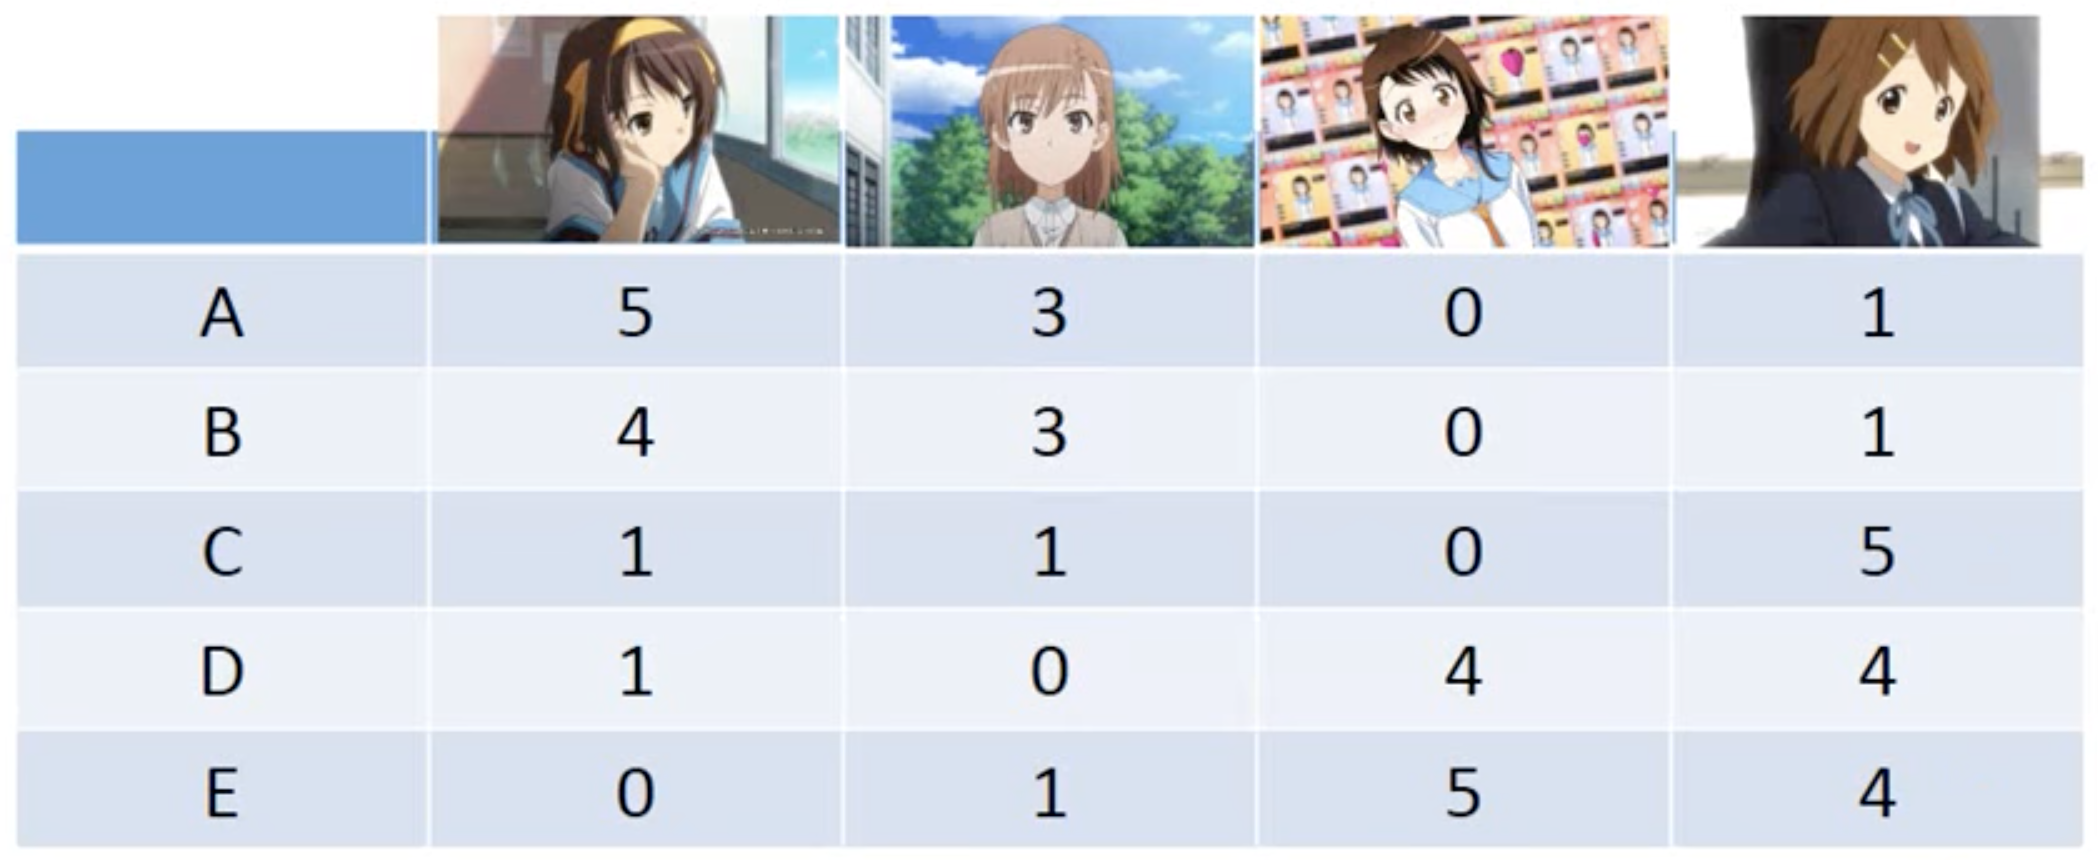
and the latent vectors
Using SVD to Minimize the Recostruction Error
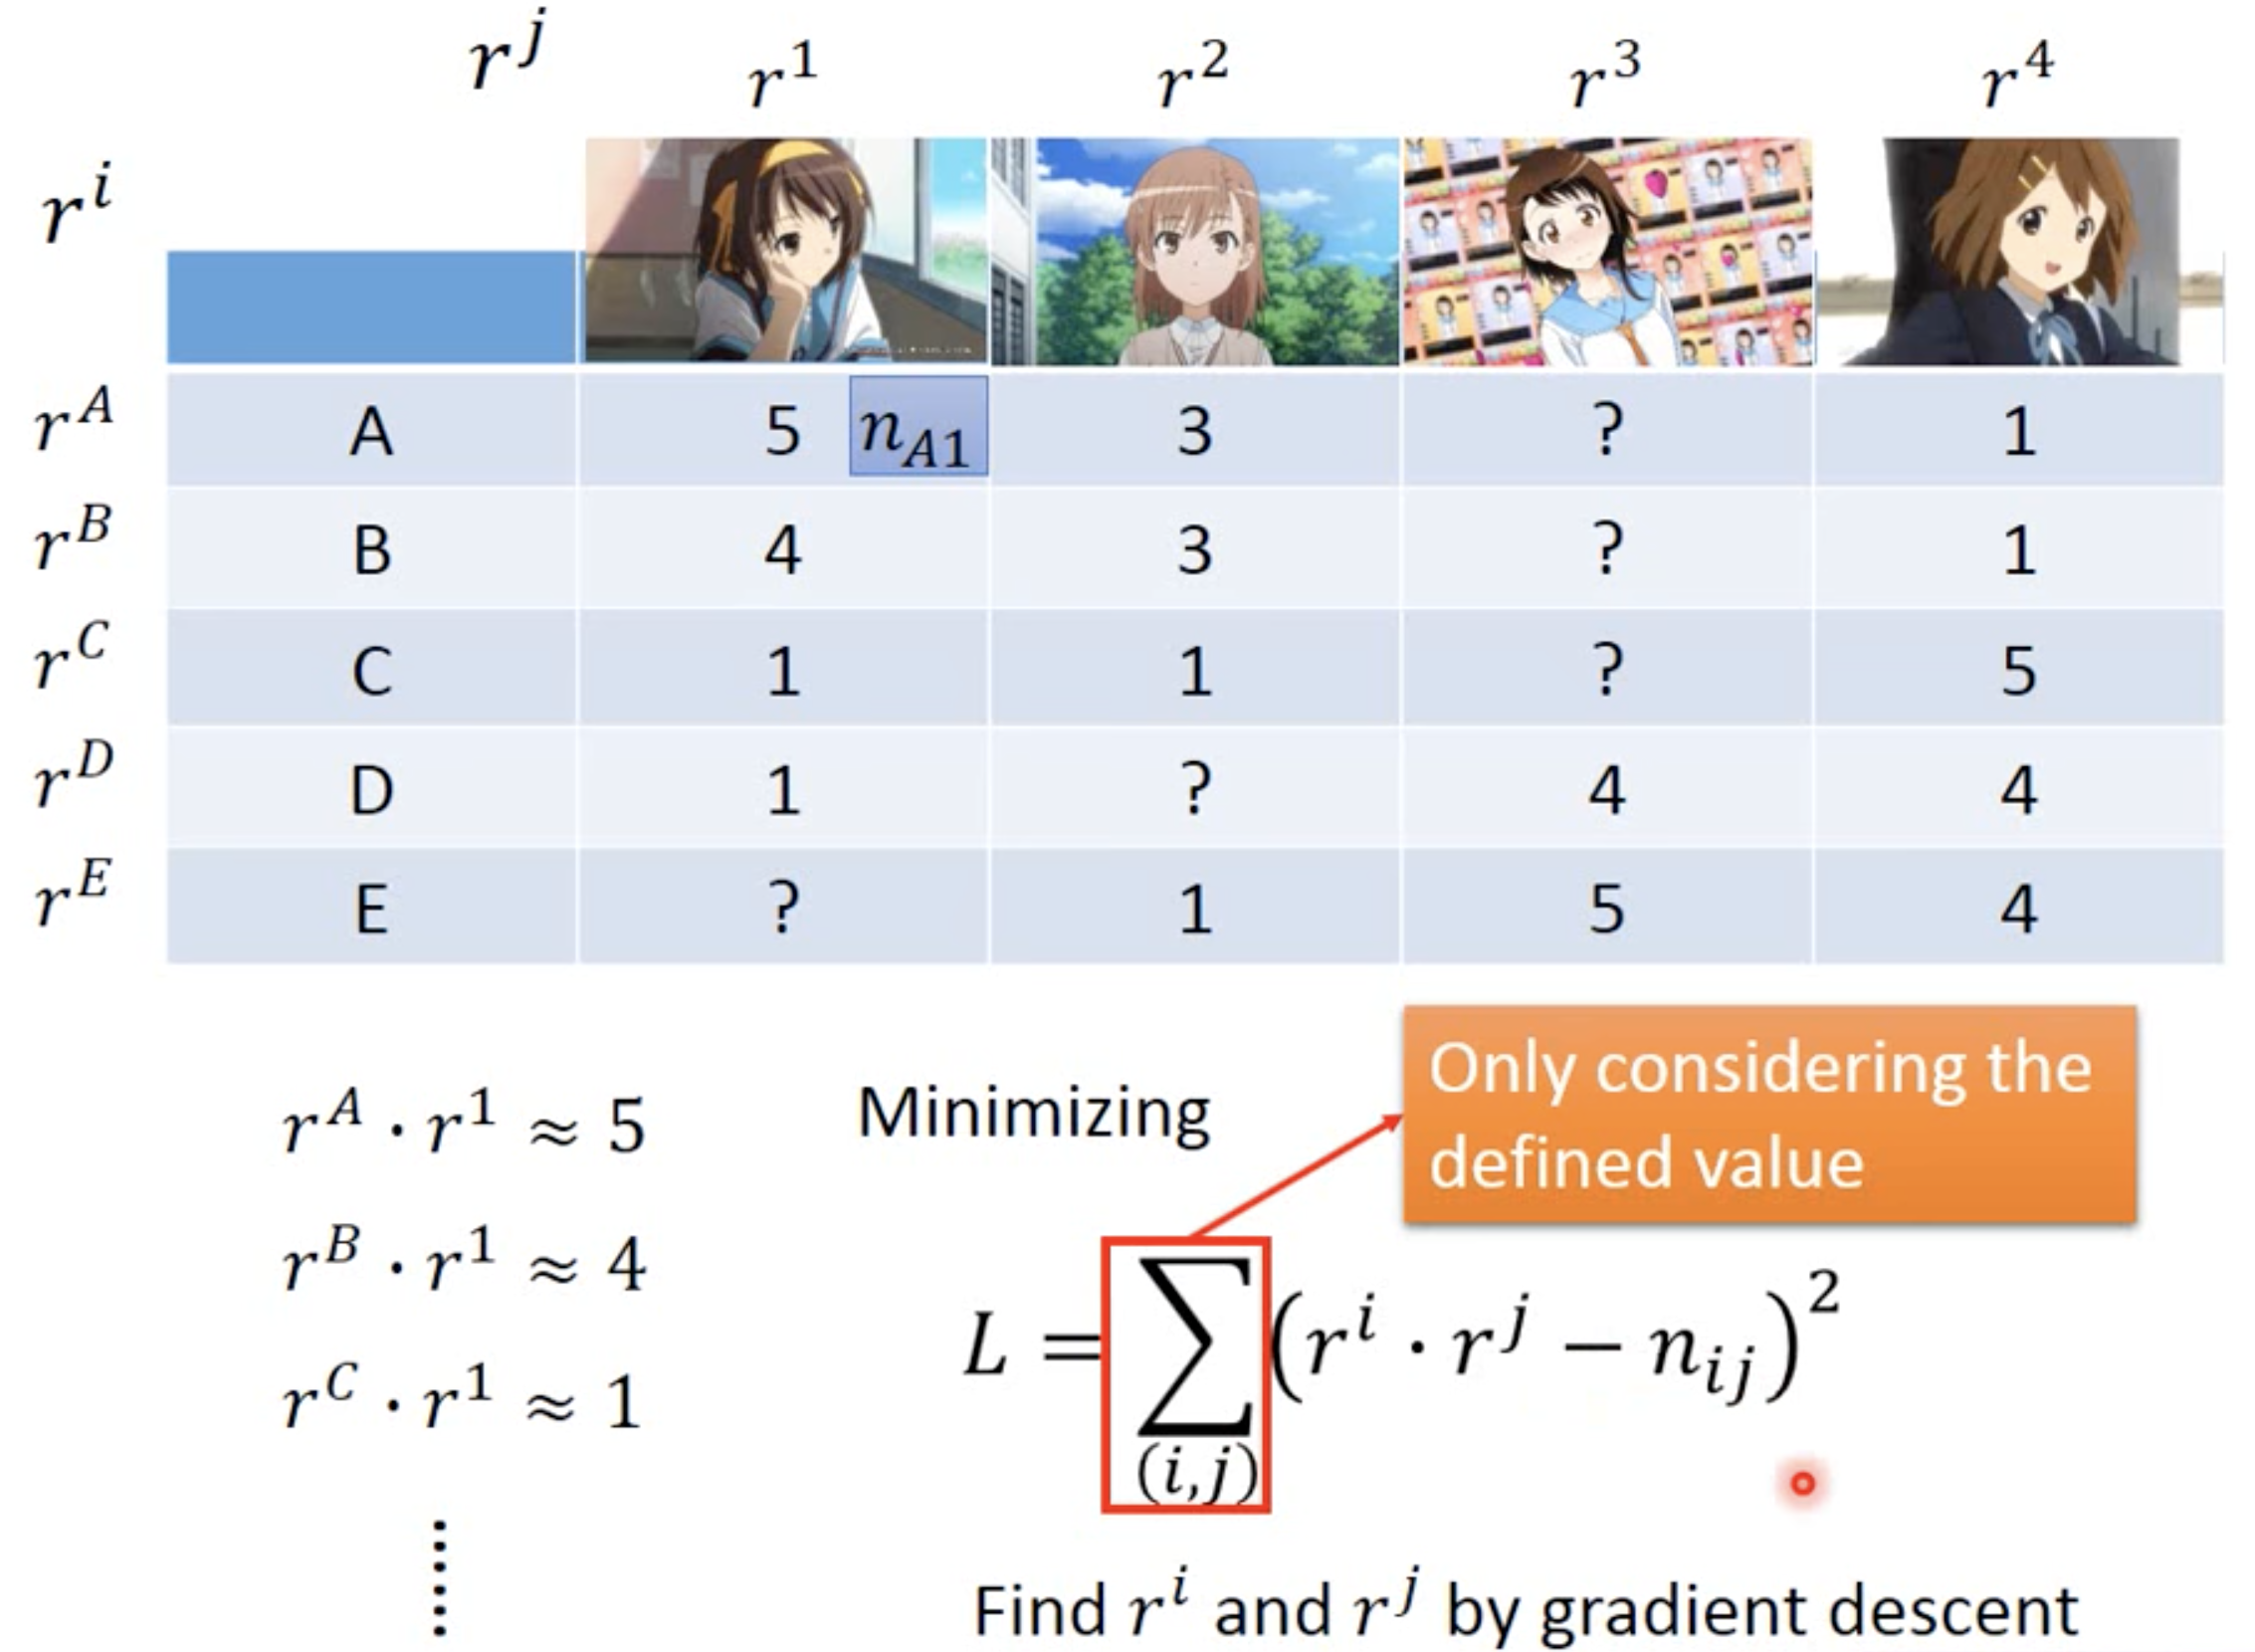
Using Gradient Descent to Minimize the Recostruction Error
In some cases, the data may be missing for some pairs of variables and targets. We can use gradient descent to find minimize the reconstruction error and find the latent vectors. Moreover, by using gradient descent, we can even add biases for all the latent vectors.
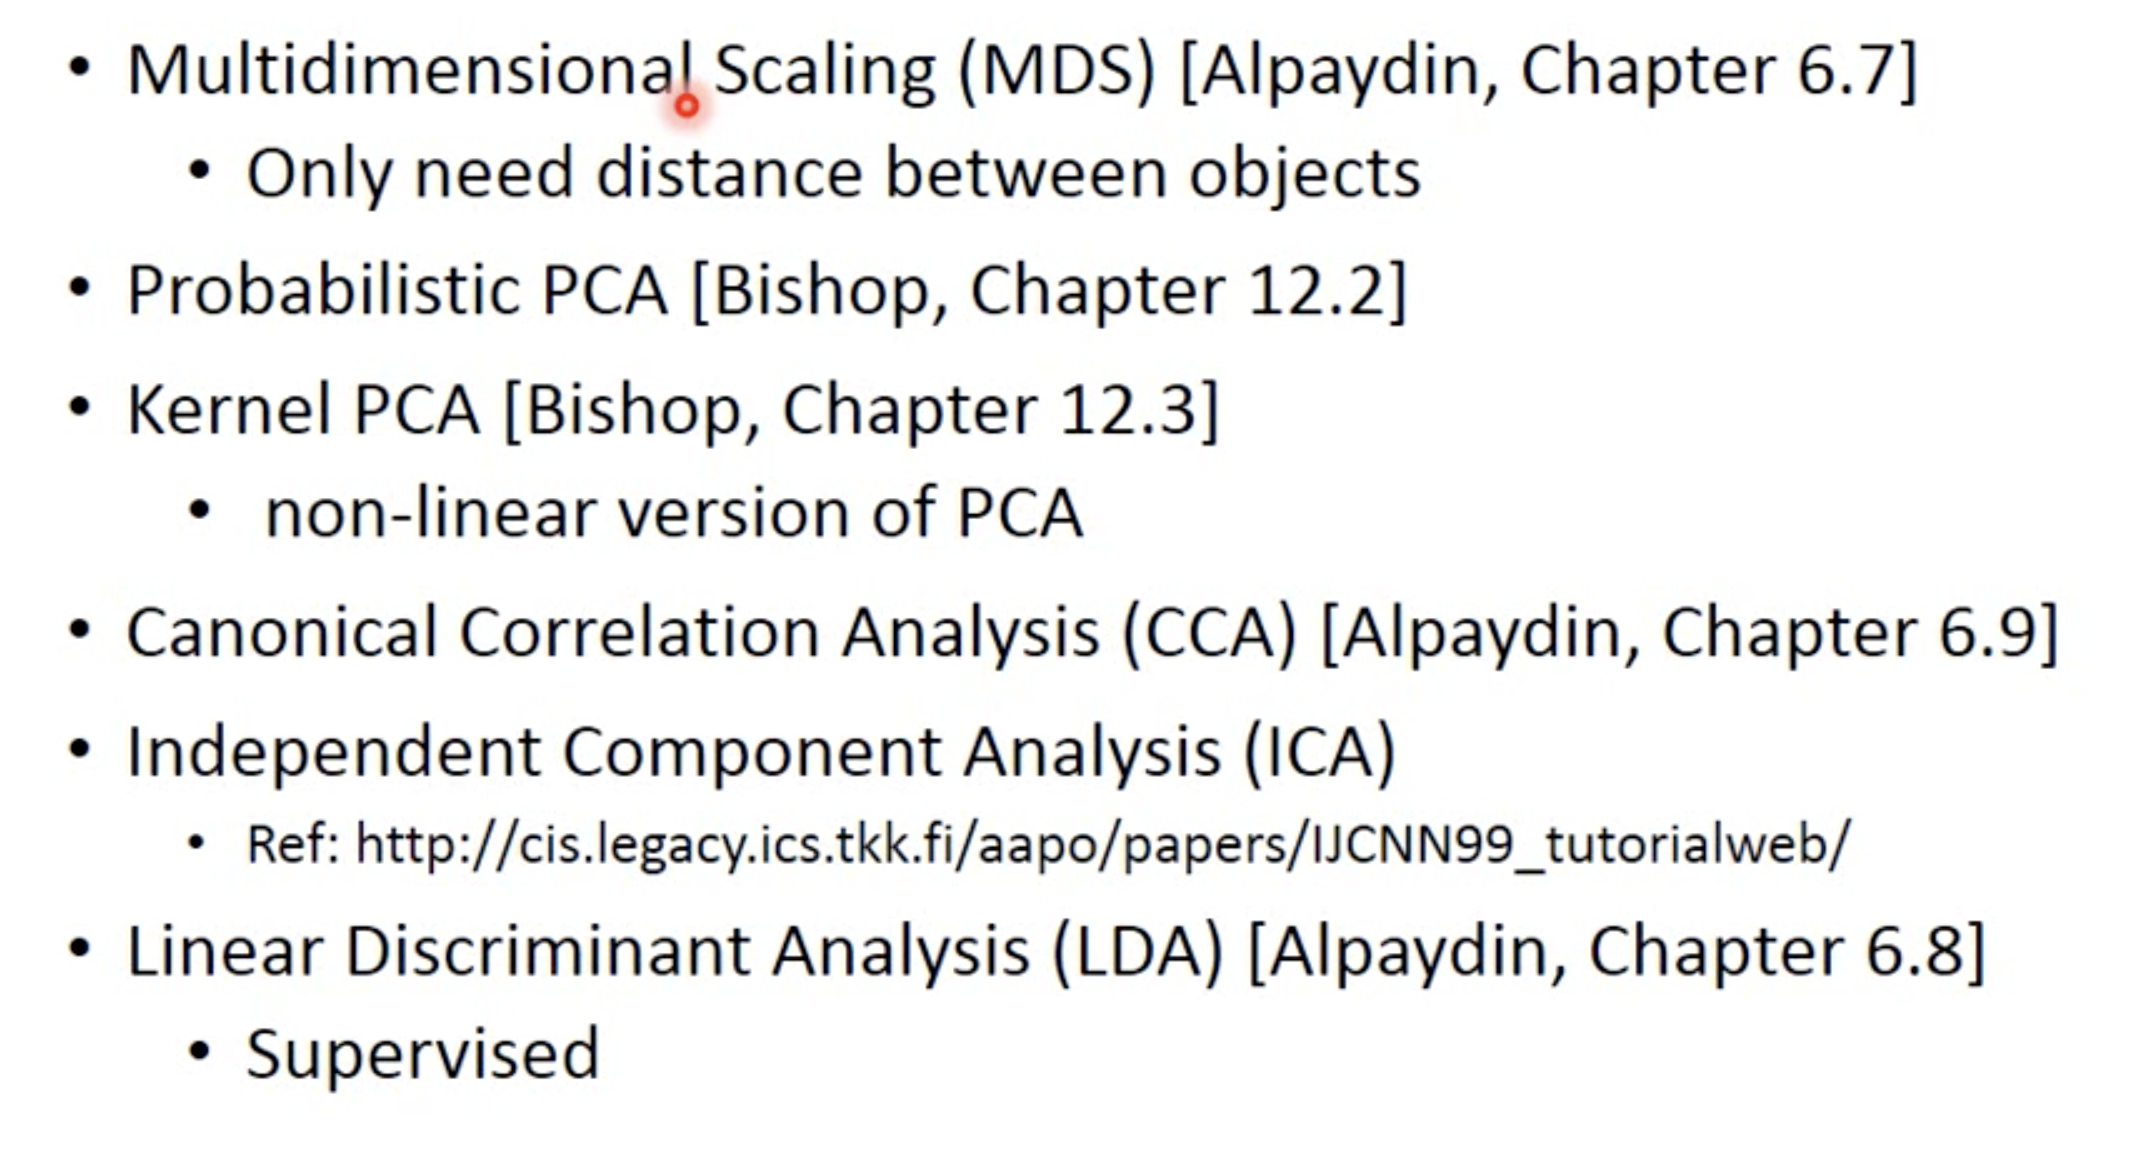
More Approaches
CCA can be used for the cases with multiple data sources, e.g. having both voice data and image data of mouth shapes for speech related tasks.
ICA can be used for source separation; just find independent but not orthogonal vectors.
References
More about PCA: Bishop Chap.12
Proof of minimizing reconstruction error = mazimize z varriance, see Bishop 12.1.2
Youtube ML Lecture 13: Unsupervised Learning - Linear Methods